Advanced Data Visualizations with Plotly and Vizro
KPI Superstore Insights with Dash
KPI Analysis for Superstore Data
Exploring Plotly Express with Vizro Palettes
Enhanced Flex-based Text Renderer
Performance Metrics Visualization
Cross-filter Interactive Heatmap and Table
Interactive Life Expectancy Comparison
Interactive Tips Analysis with Vizro
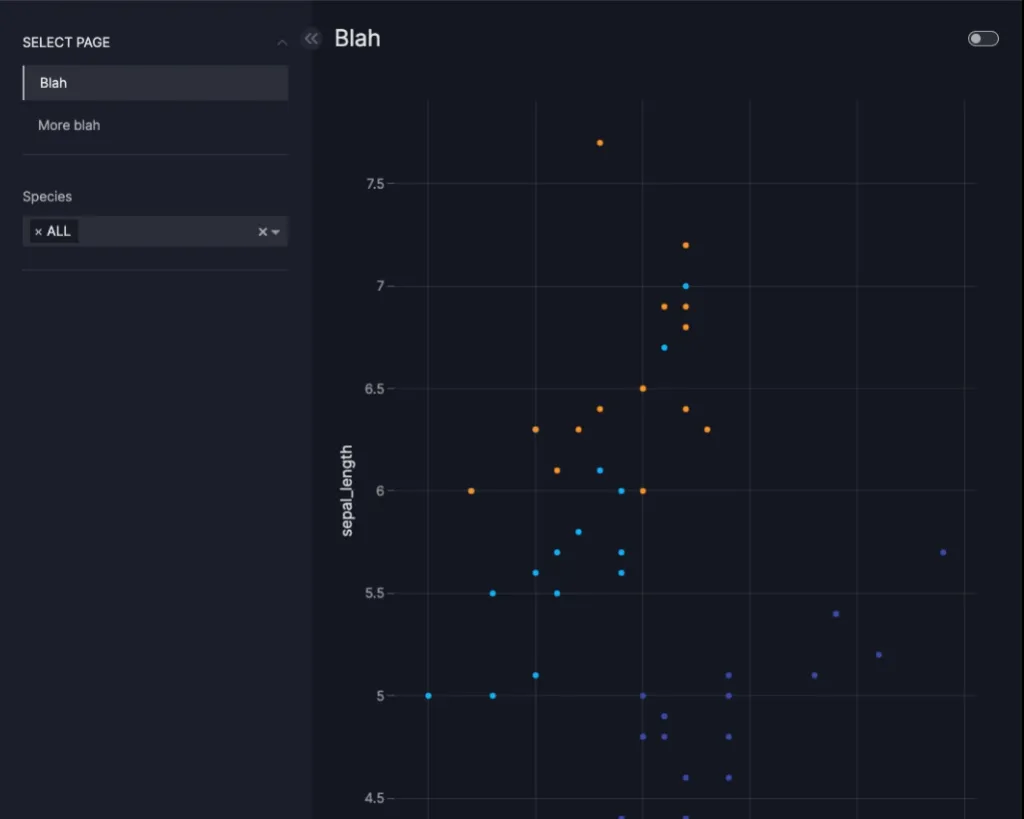
Cross-filter Analysis on Iris Dataset
Analyzing Iris Dataset with Vizro
Visualizing Iris Flower Data with Dash and Plotly
Dynamic Gapminder Analysis
Global Electricity Access Insights
Dashboard to YAML
YAML dashboard
Highlight Country and Filter Table with Vizro
Current Day Finder
Cross-filtering Tips Data
Exploring Iris Data with Vizro
Analyzing H1 Sales Patterns with Vizro
Data Visualization with Vizro
Custom Carousel Image Viewer
Carousel Image Slider with Interactive Controls
Exploring Iris Dataset with Vizro
Call Center Performance Analysis
Building Dashboards with Kedro and Vizro
Opinions on Pastries
Species Analysis for Iris Dataset with Vizro and Plotly Express
Global Development Insights with Vizro
Dynamic Data Visualization Demo - Vizro