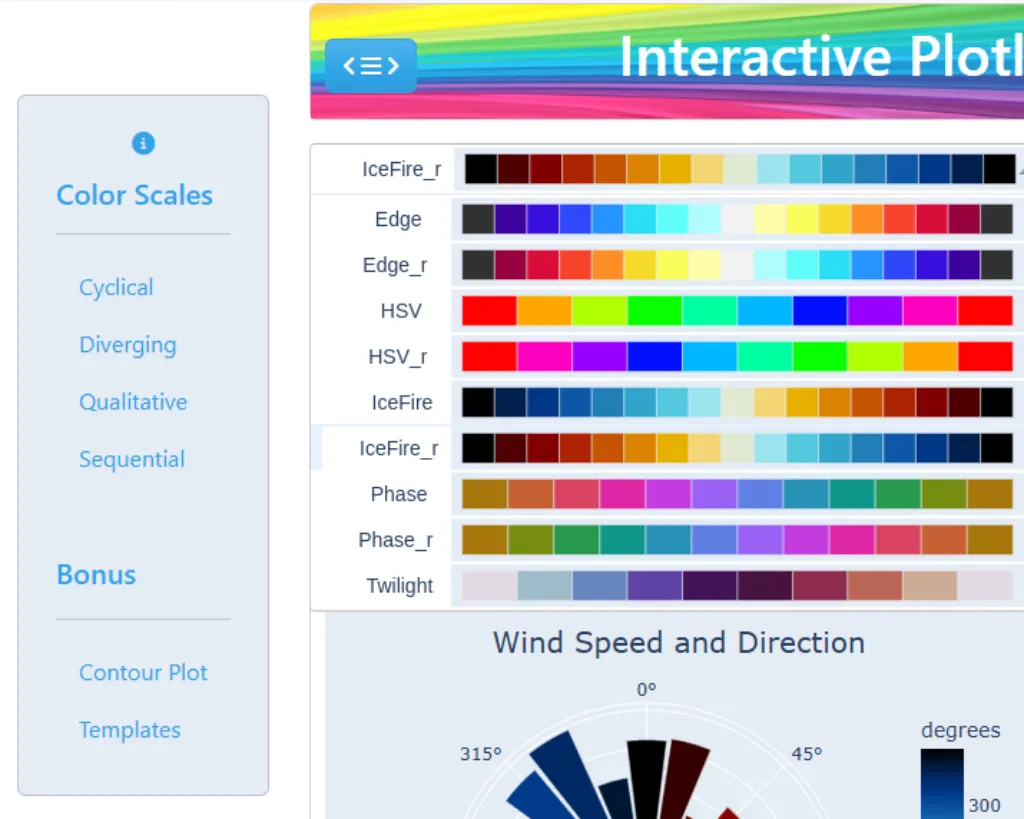
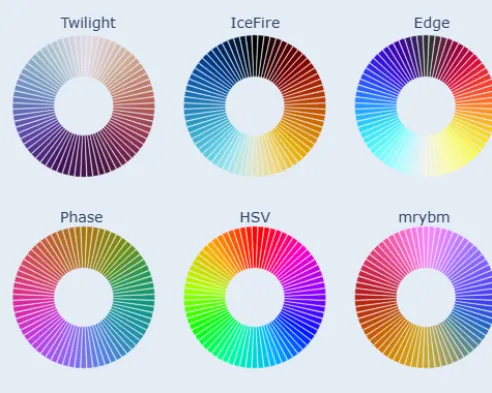
Interactive Plotly Express Color Scale Selection
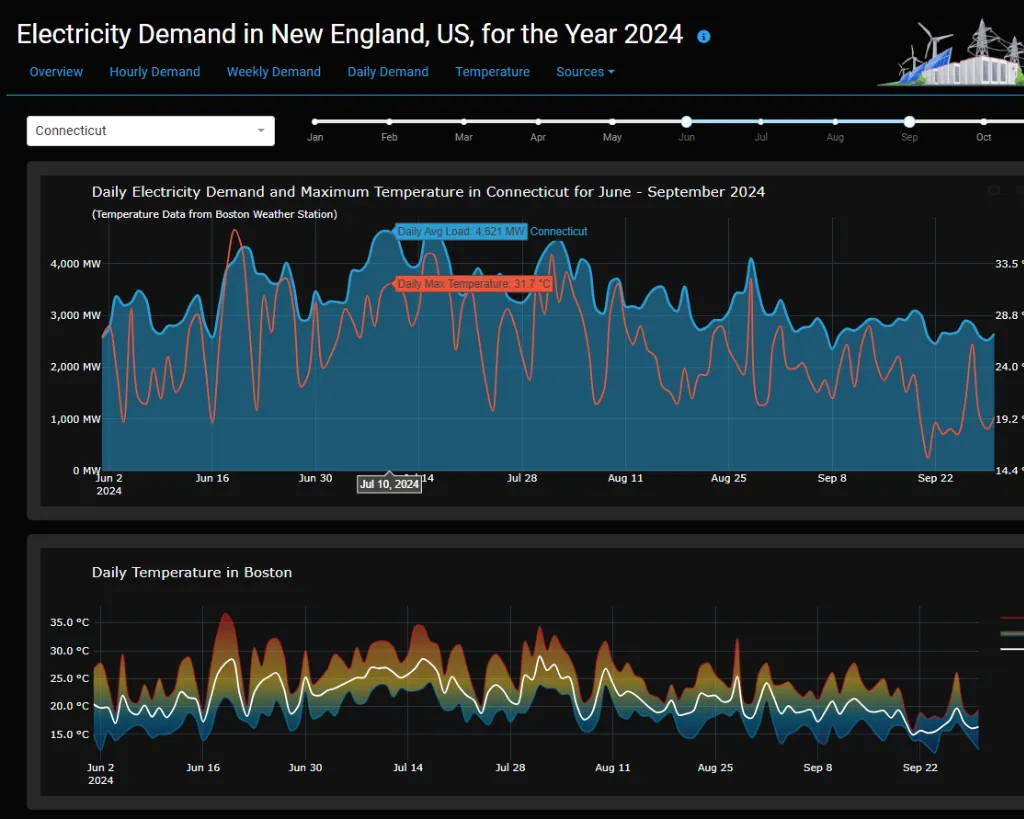
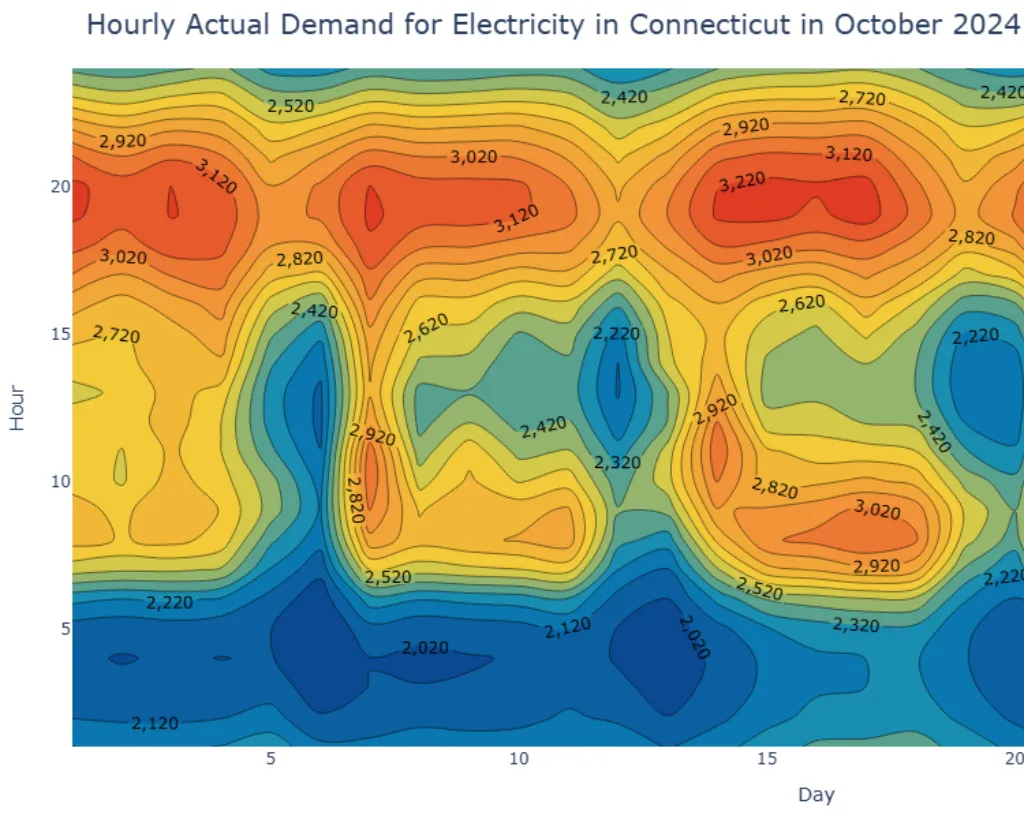
Electricity Demand Dashboard Using Dash and Plotly
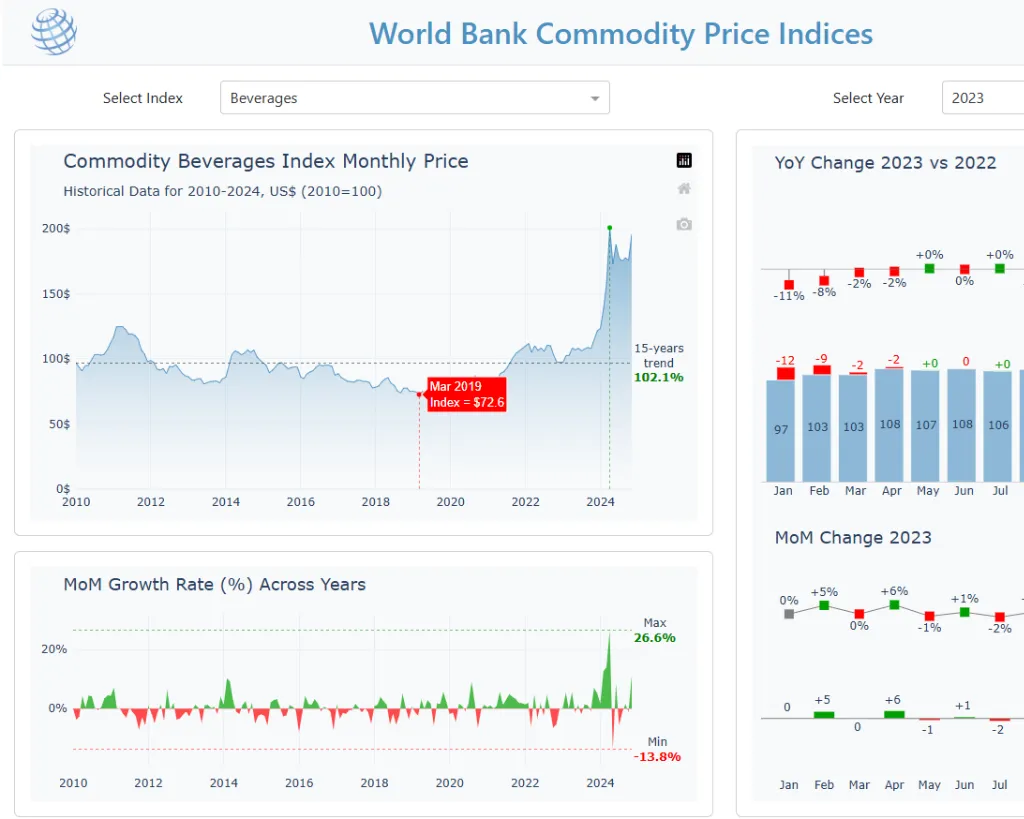
World Bank Commodity Price Indices Dashboard - Dash
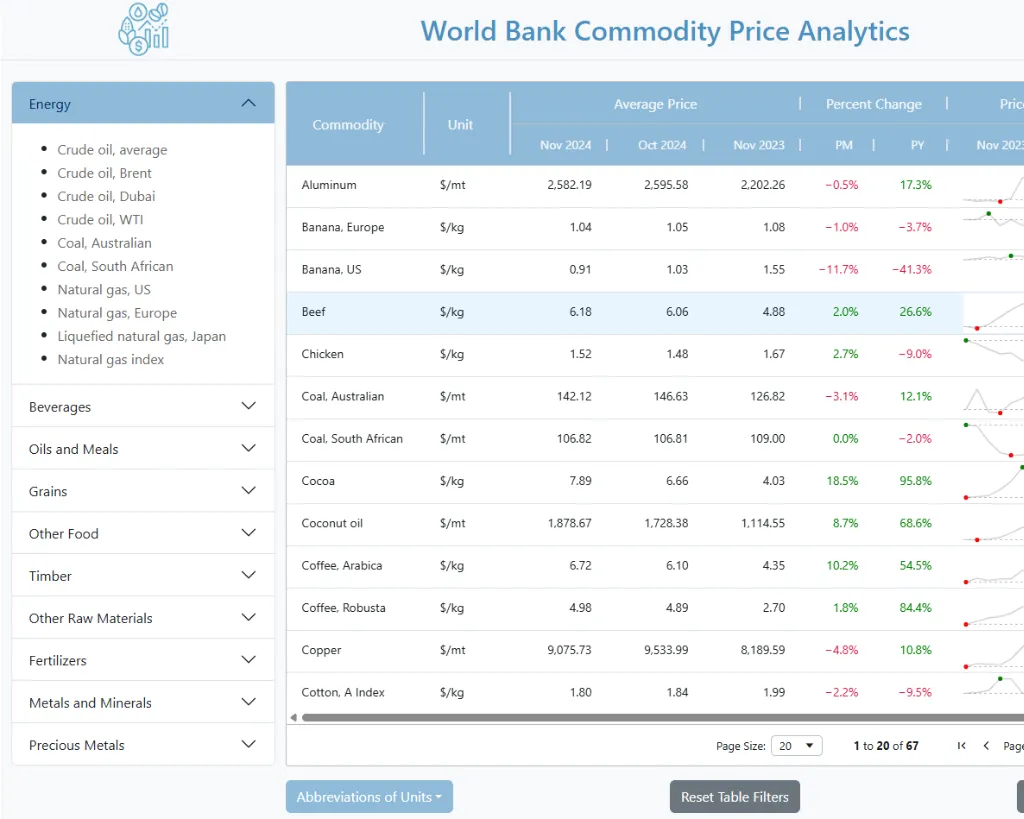
Commodity Prices and Trends Analytics - Dash AG Grid
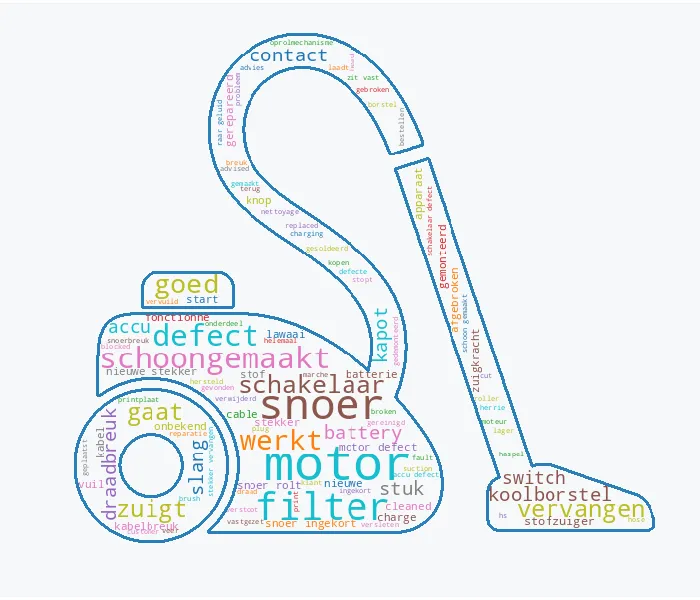
Interactive Word and Bigram Analysis Dashboard - Plotly & Dash
Plotly Express Sequential Colorscale Visualizer
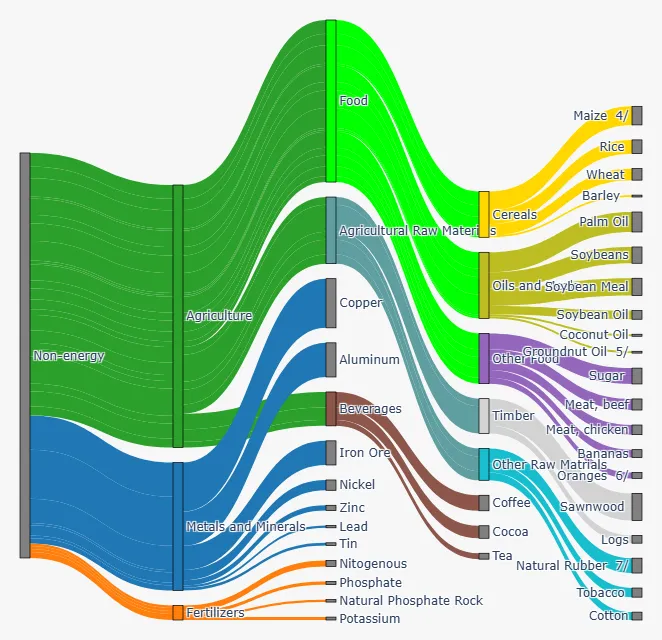
Sankey Diagram for Non-Energy Commodity Group using Dash and Plotly
Dynamic Contour Plot of Electricity Demand with Plotly
Plotly Built-In Colorscale Viewer using Dash
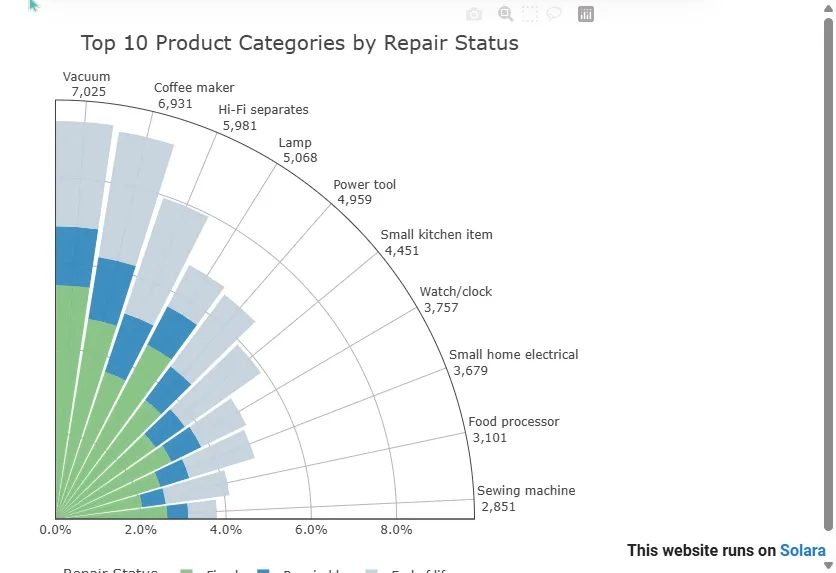
Repair Status of Top 10 Product Categories