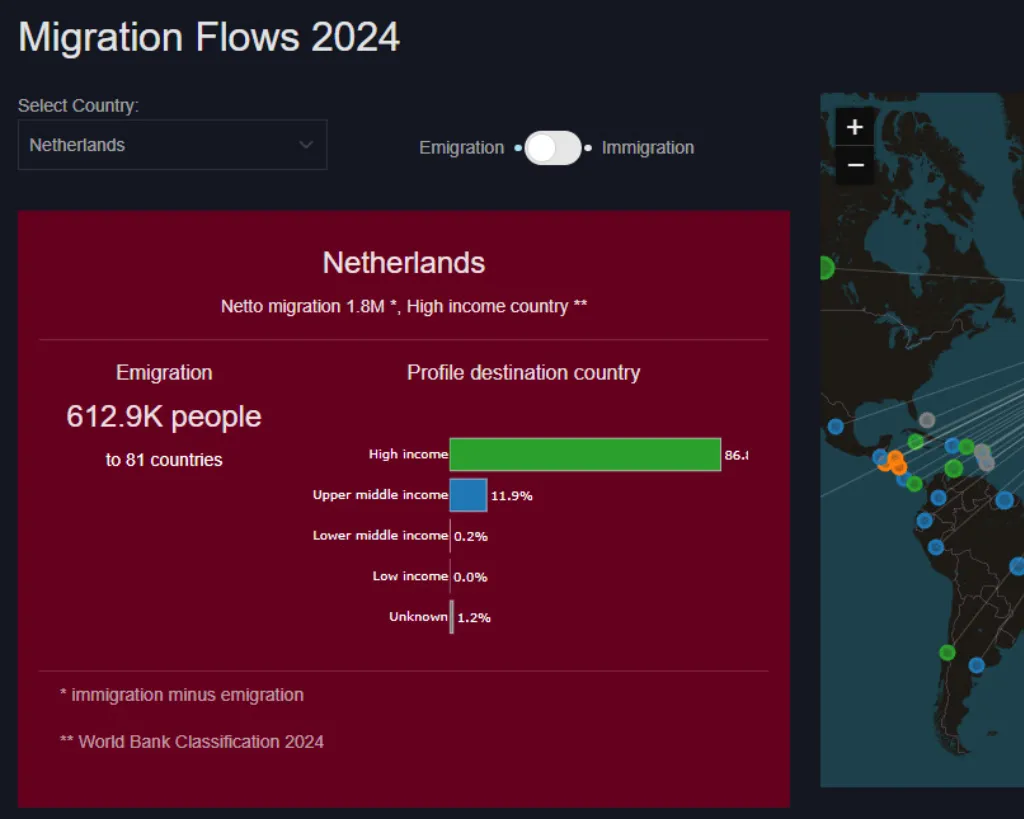
Overview migrant stock per country, details on country income classification emigration and immigration
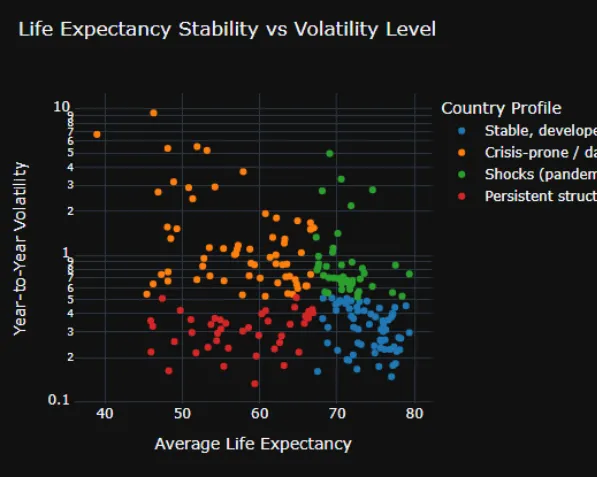
In which country has "life expectancy at birth" changed the most?
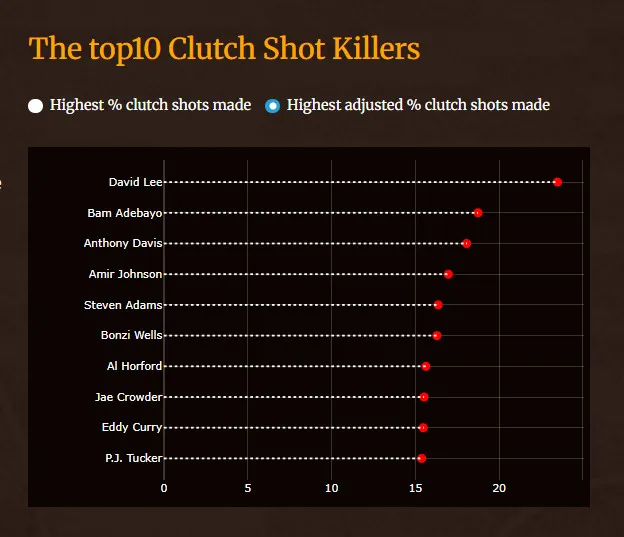
Onepager trying to explain NBA clutch with some interactive plots.
Billboard Hot 100
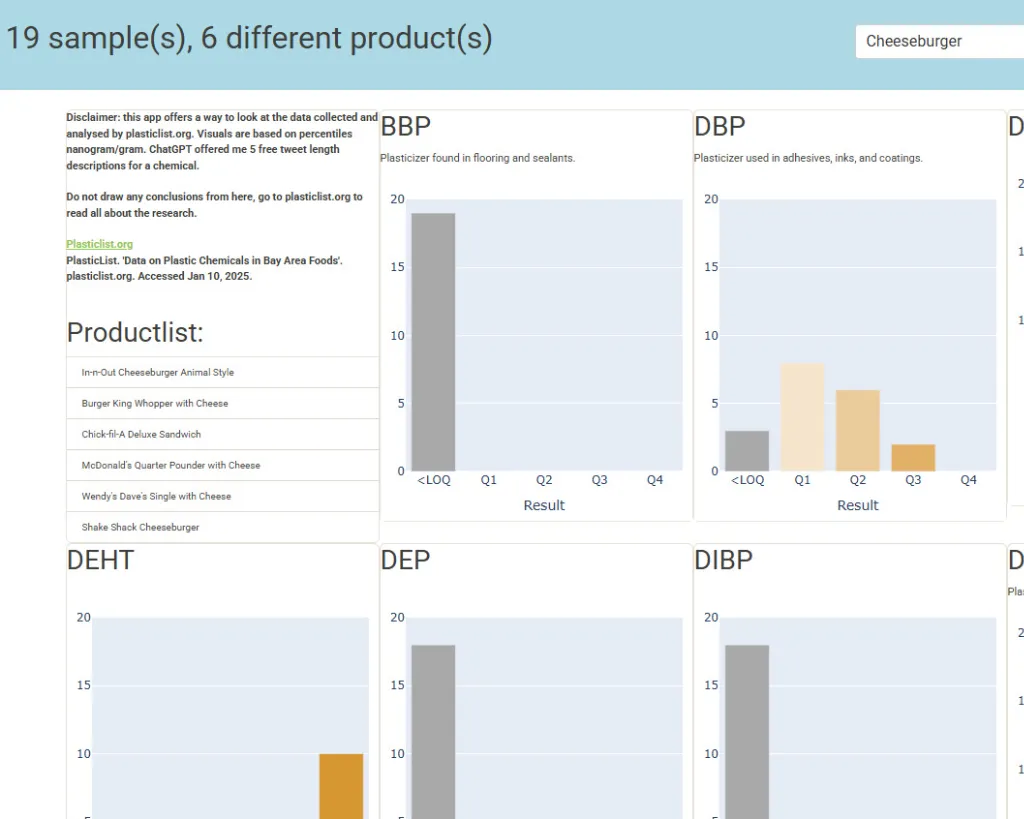
A way to browse the data of plasticlist.org, no conclusions. One fixed card to start cardgrid. Not optimally styled.
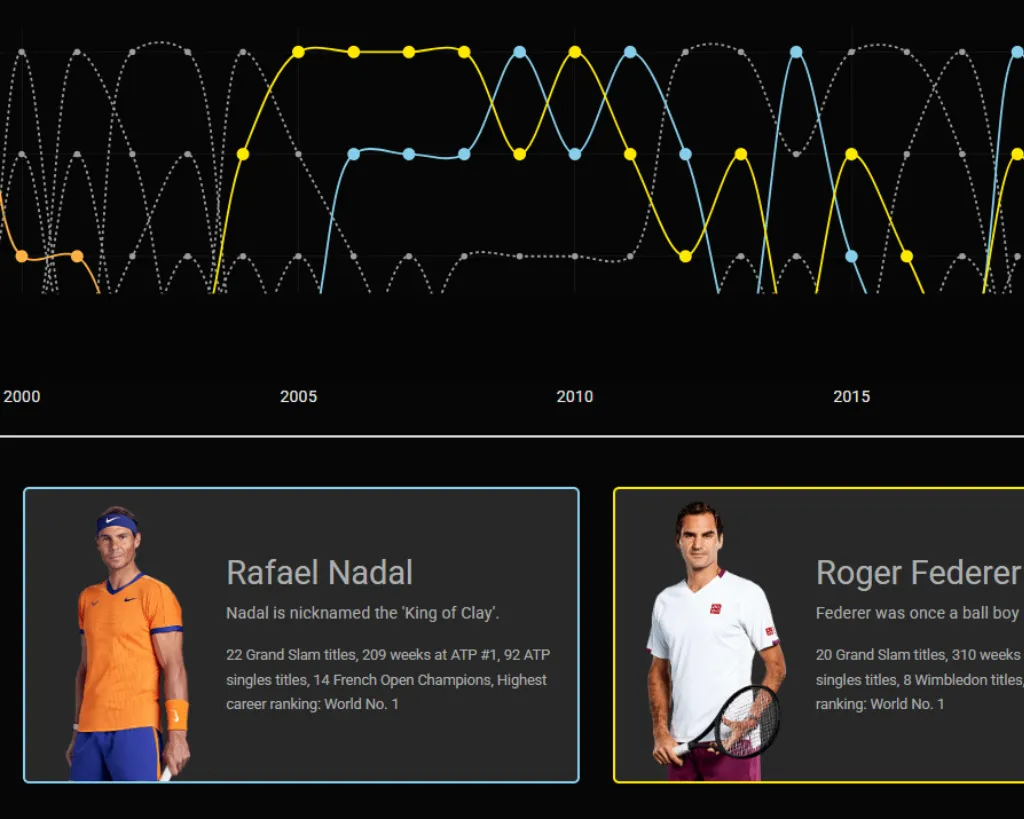
ATP end of year top3, 1992 - 2024
Don't make me think :-)
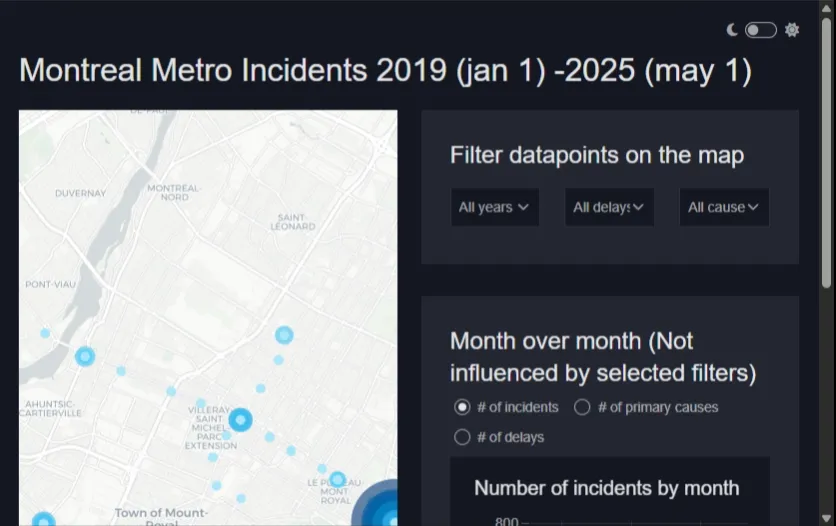
Montreal metro incidents
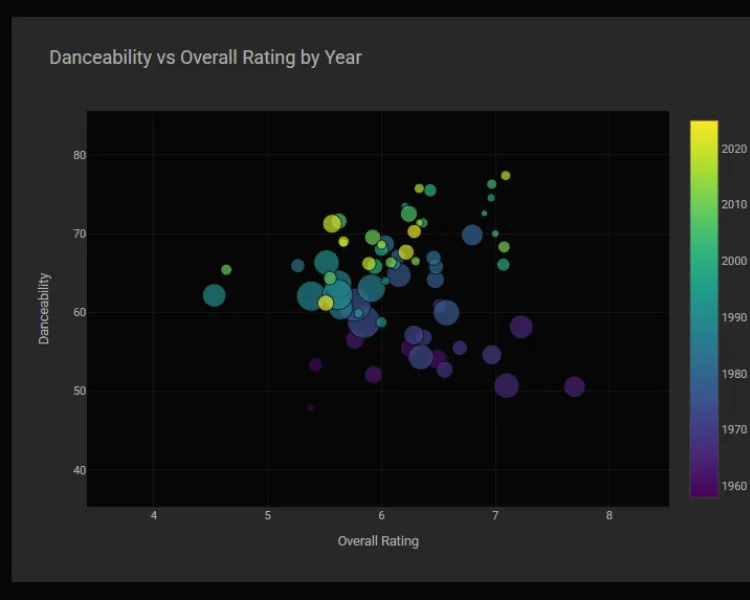
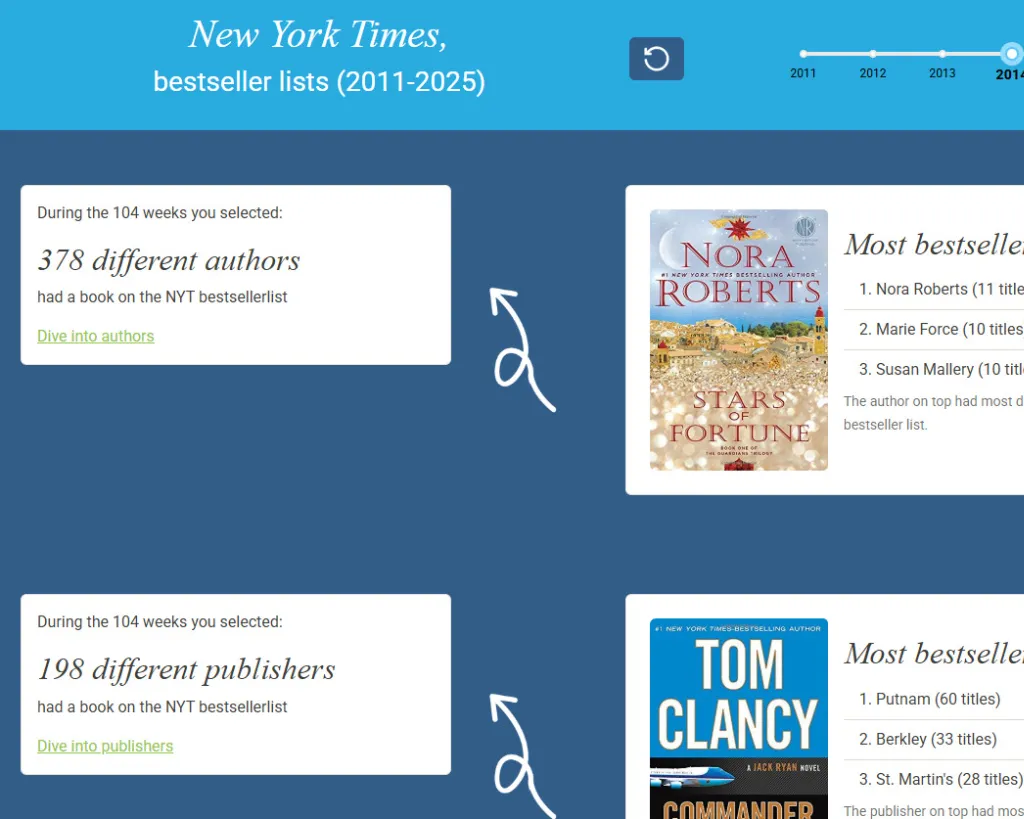
Discover new books based on Goodreads, limited dataset 1980-1990
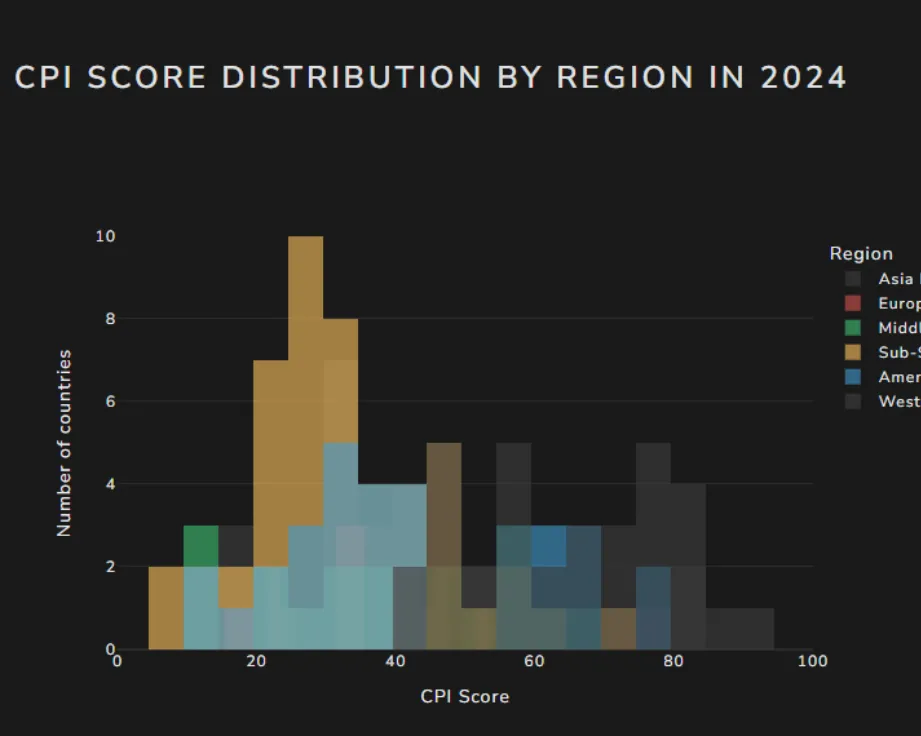
An idea about visualising CPI scores, not the best idea
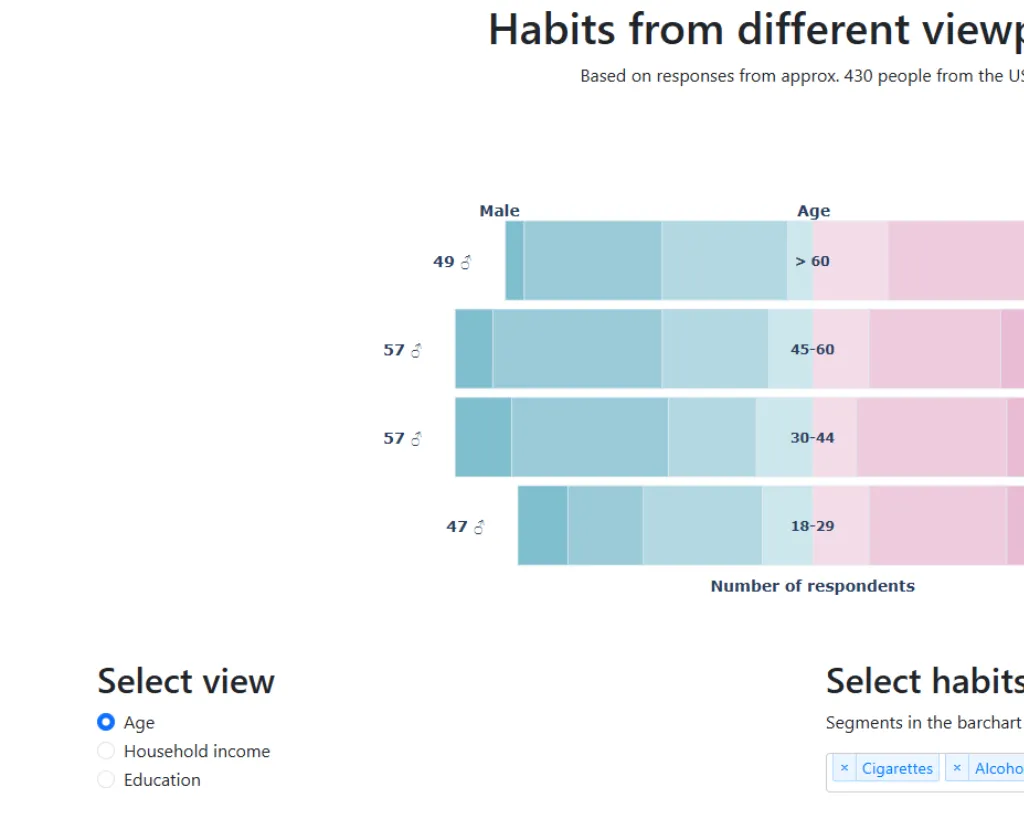
Combined habits from different viewpoints
Experiment with prompt, openrouter.ai and Claude Opus
CO2 emissions for some interesting european regions
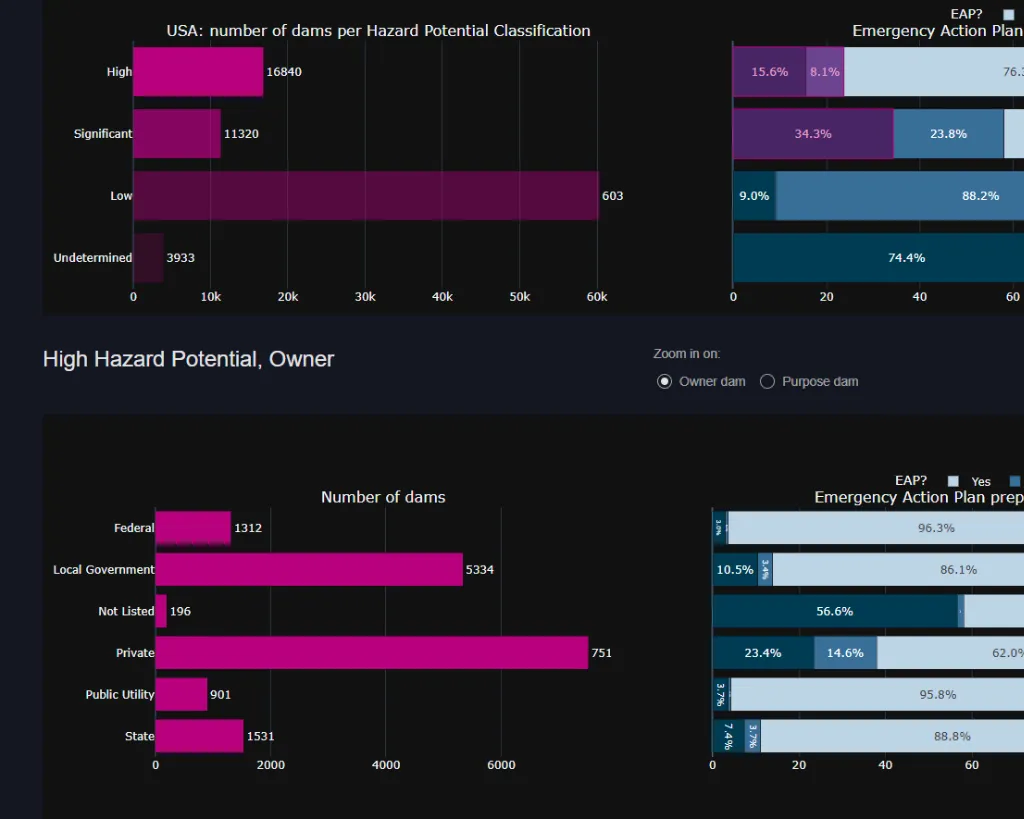
Drilldown US dams and Emergency Action Plans
Vibecoding with Gemini 2.5
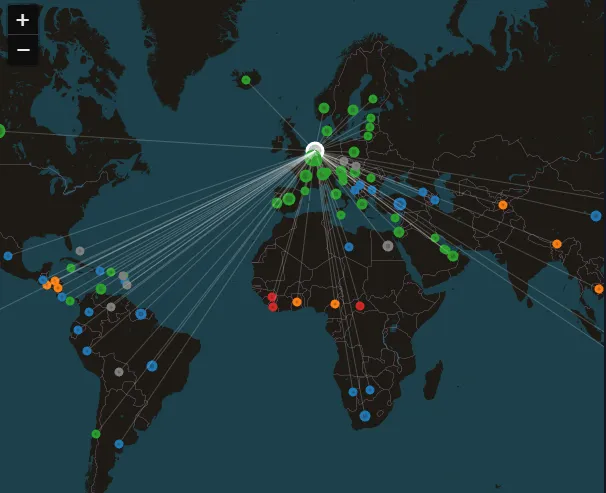
Migration flows period 1990 - 2024
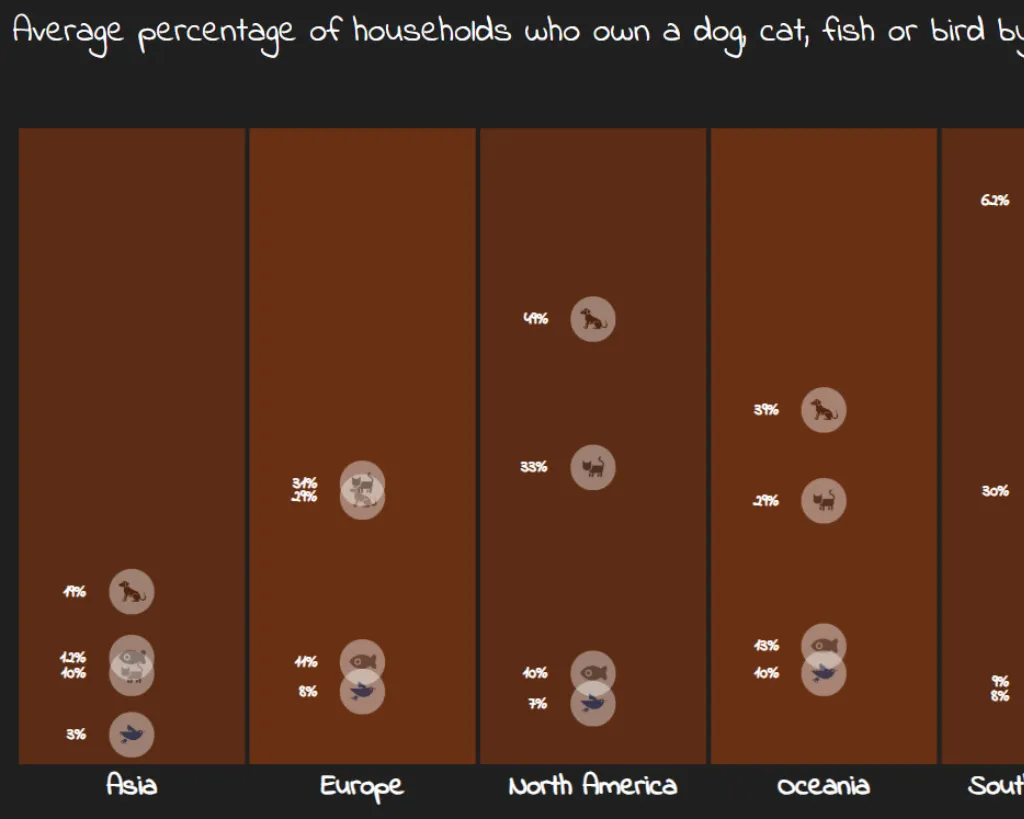
Infographic percentage of households with a dog, cat, bird or fish by continent
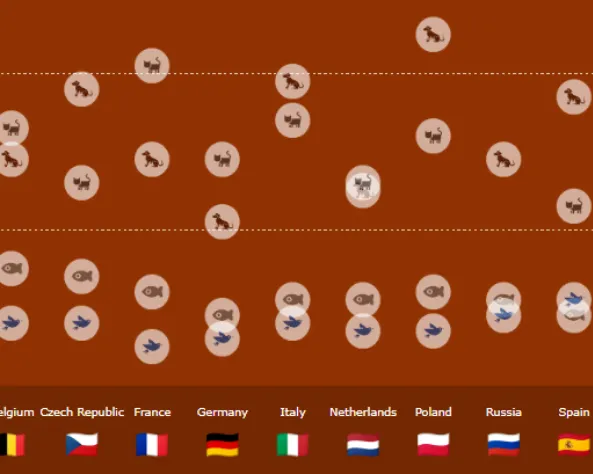
Infographic percentage of households with a dog, cat, bird or fish by country
Small dash app with one cardfunction serving 4 cards.
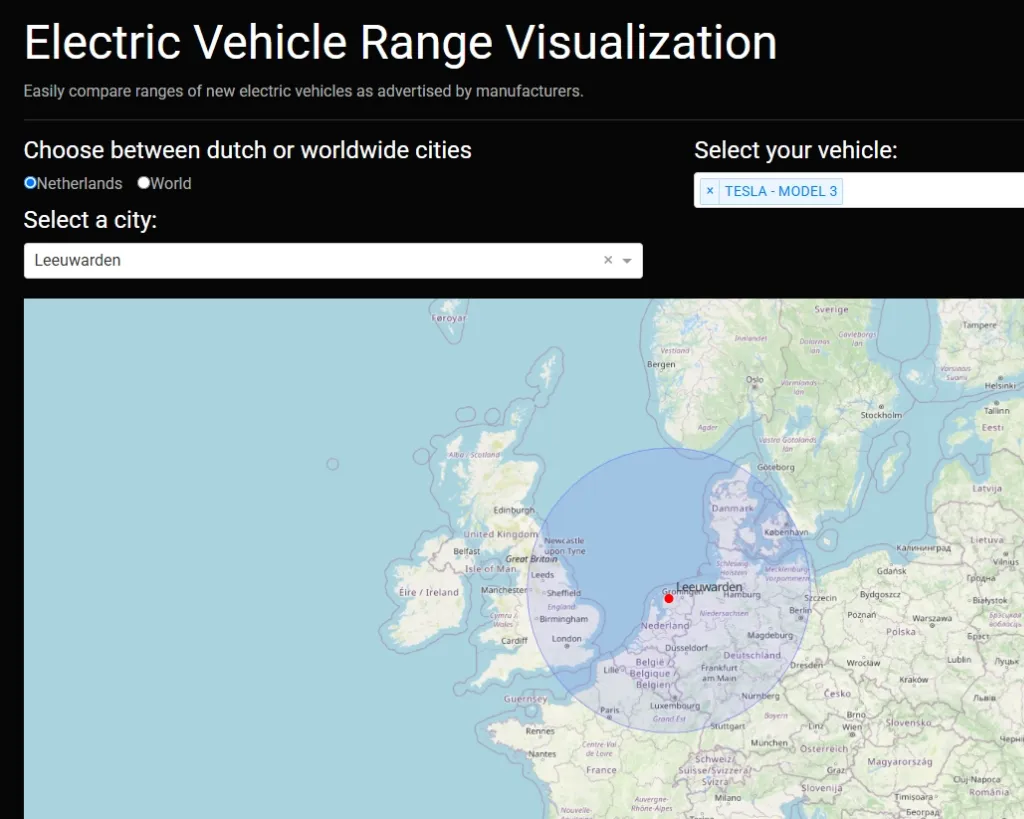
Draw range circles on a map based on the selected vehicle and marketed range.
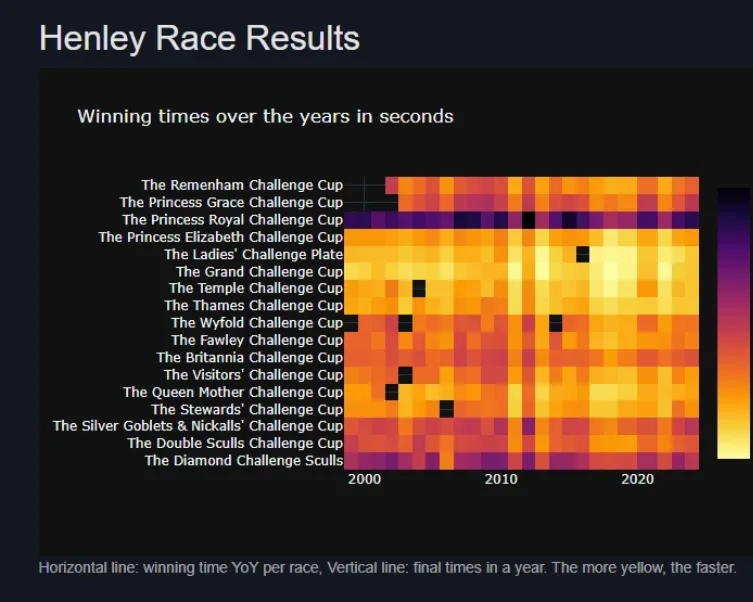
Henley Cup data
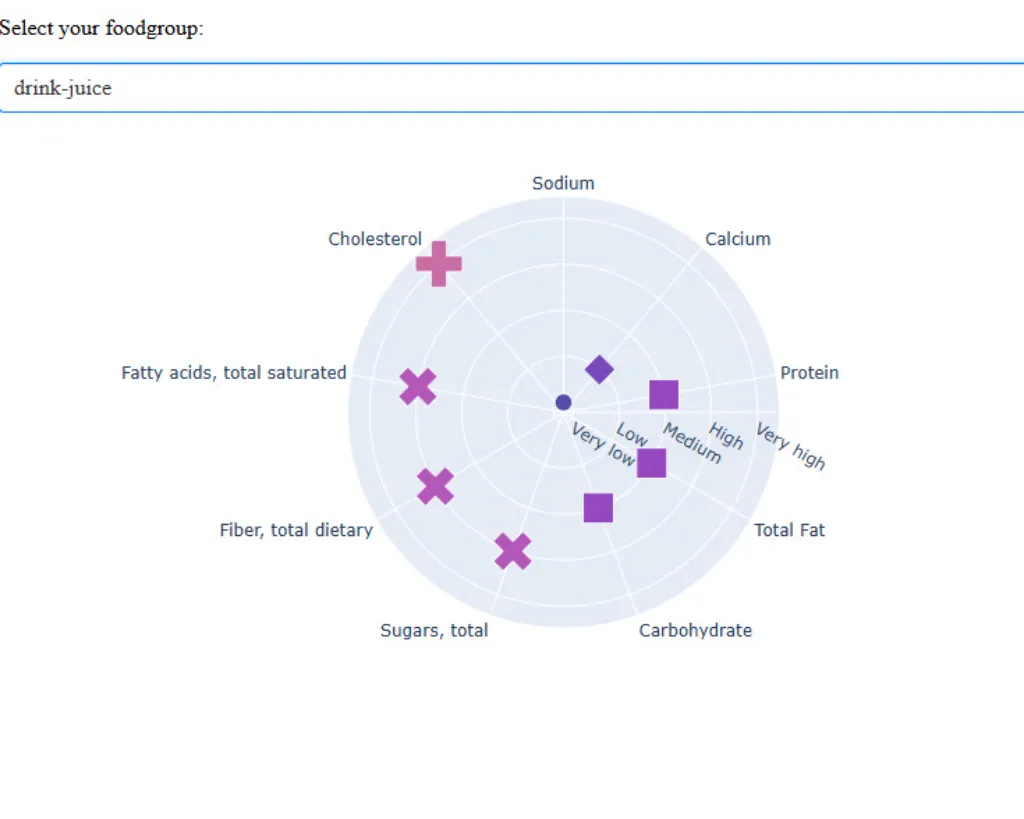
Nutrition Analysis Visualizer using Dash and Plotly (AI speaking)
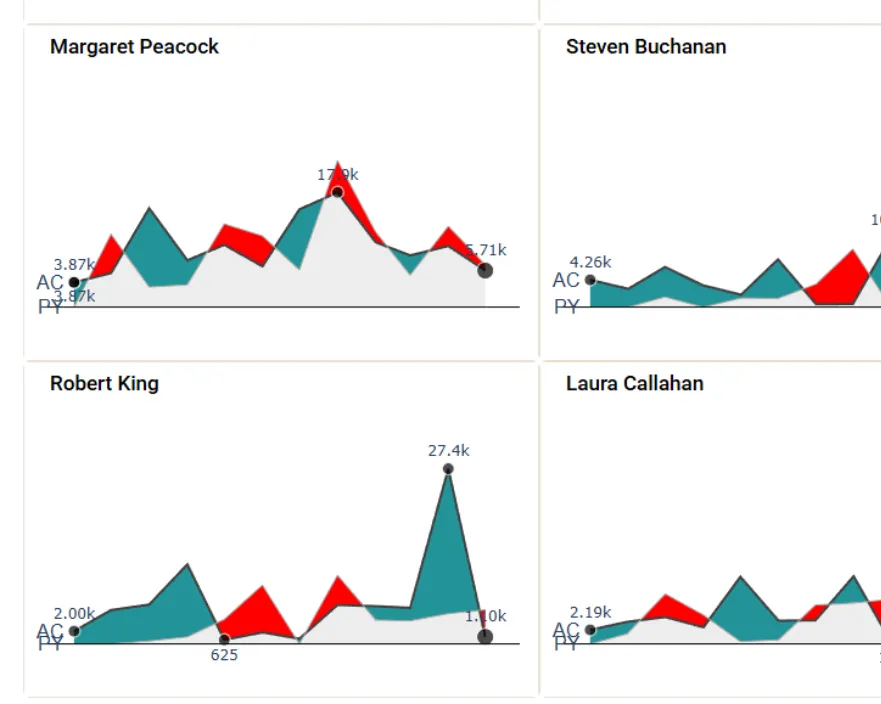
AC and LY revenue by employee in month K$
Failed experiment with ChatGPT
Pixar Movie Insights with Dash
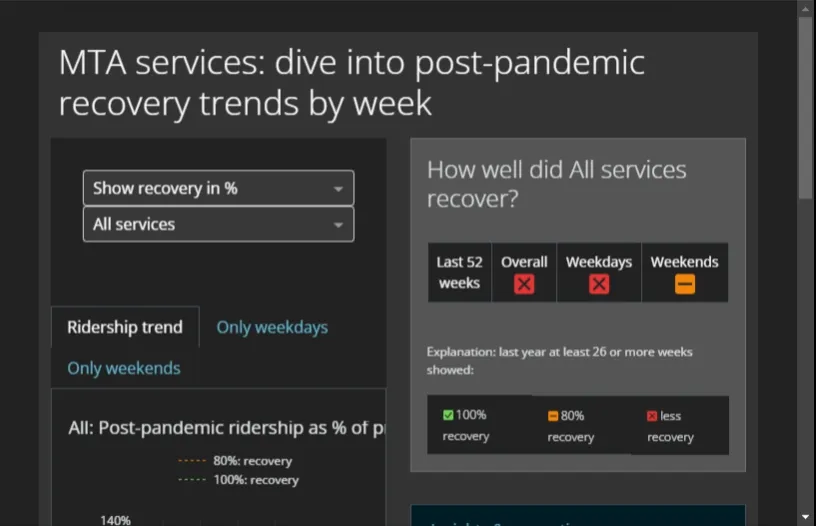
Dash submission for Maven Challenge / Plotly Holiday season 2024 on MTA ridership
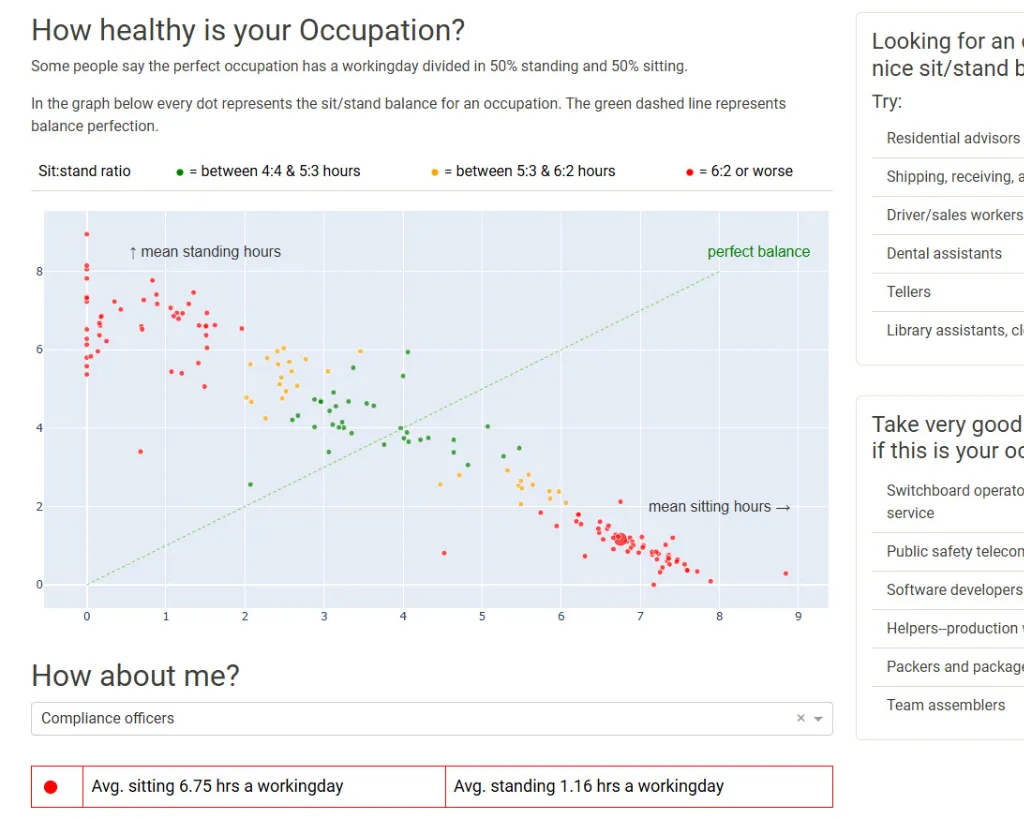
Dash scatterplot with colorcategories & interaction selected value and markersize
Work in progress, multipage dash plotly
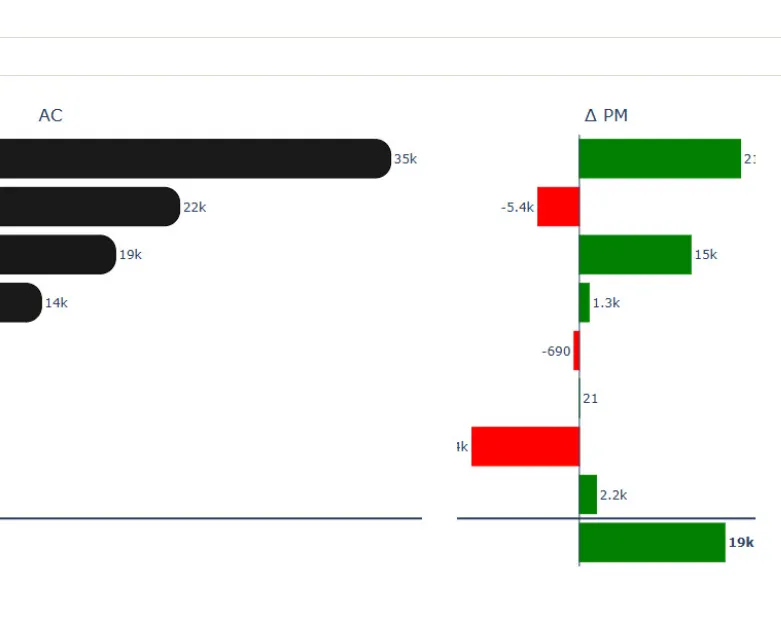
AC, delta PM and delta PM%
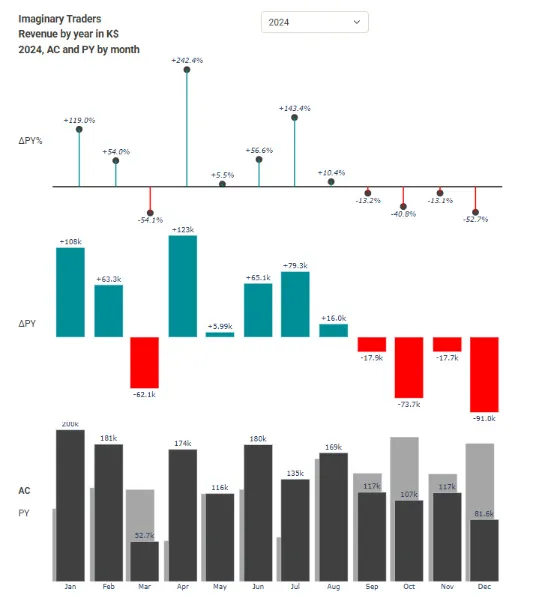
AC, delta PY and PY%
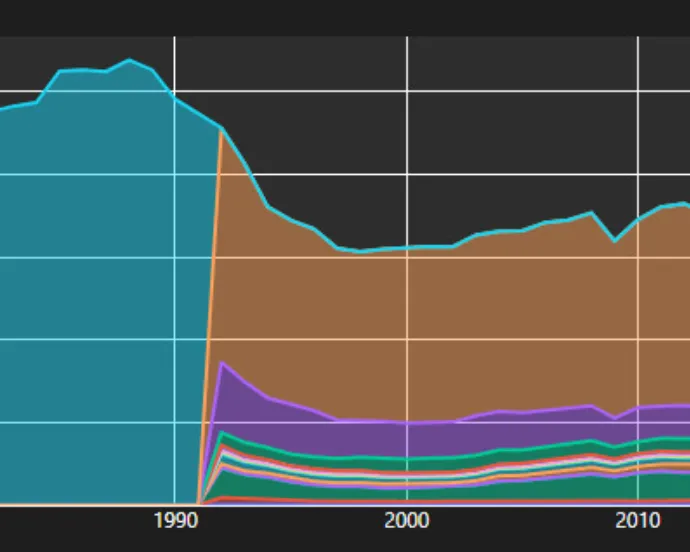
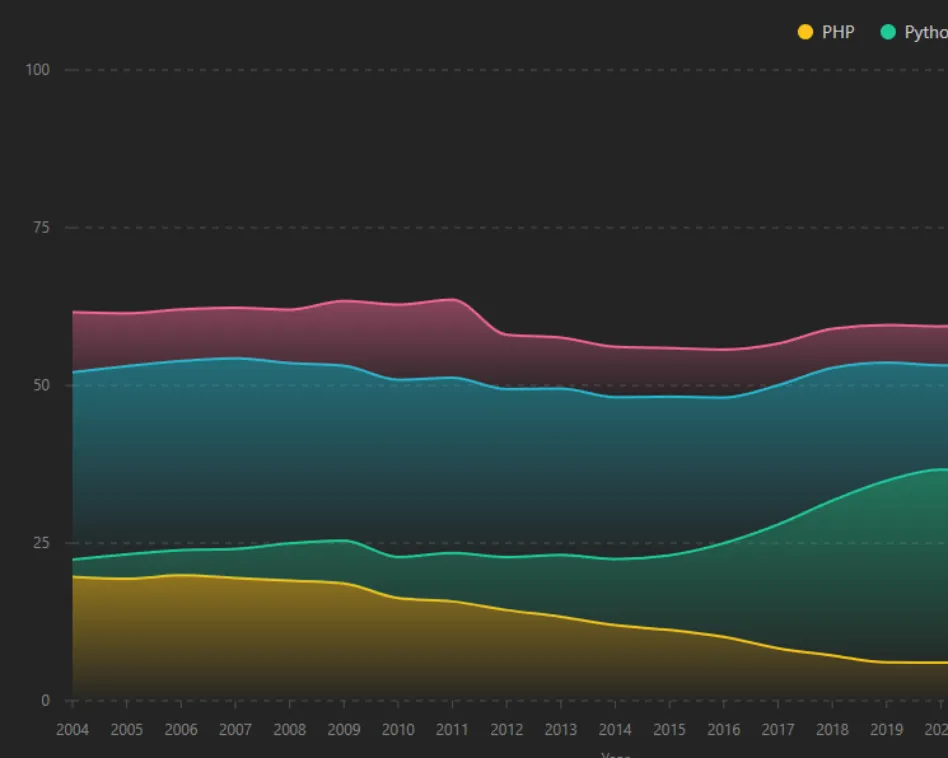
DMC experiment,stacked area chart
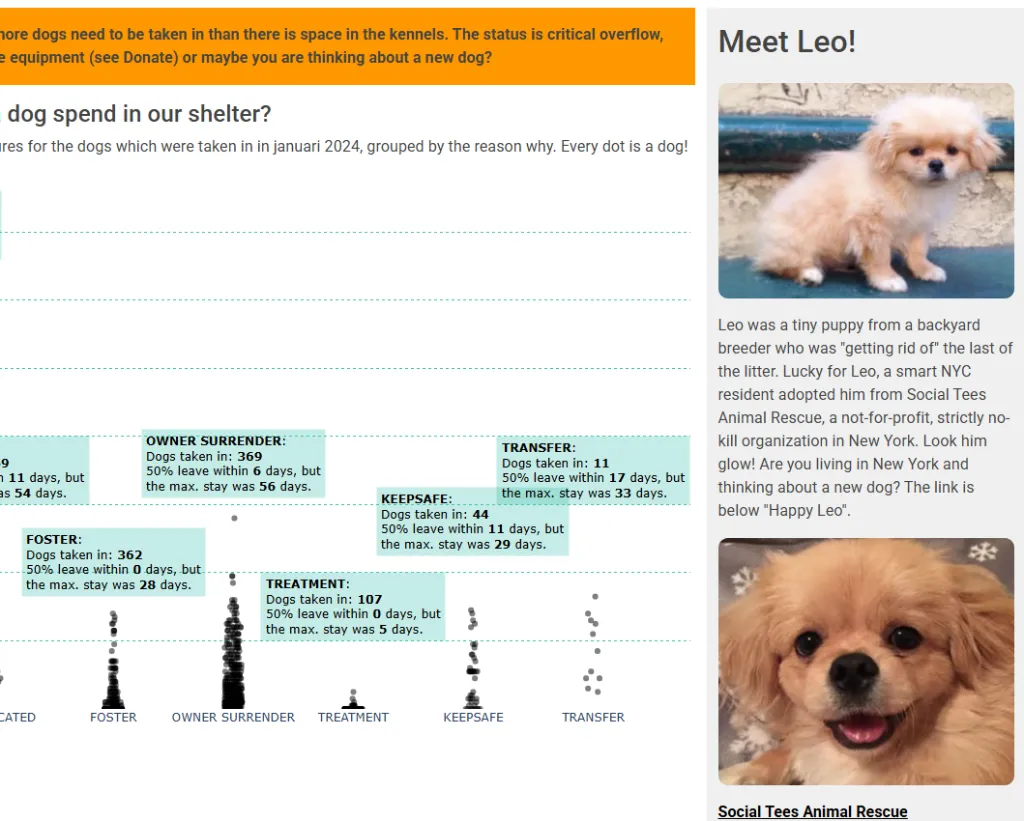
A bit of px.split, a lot of animal welfare
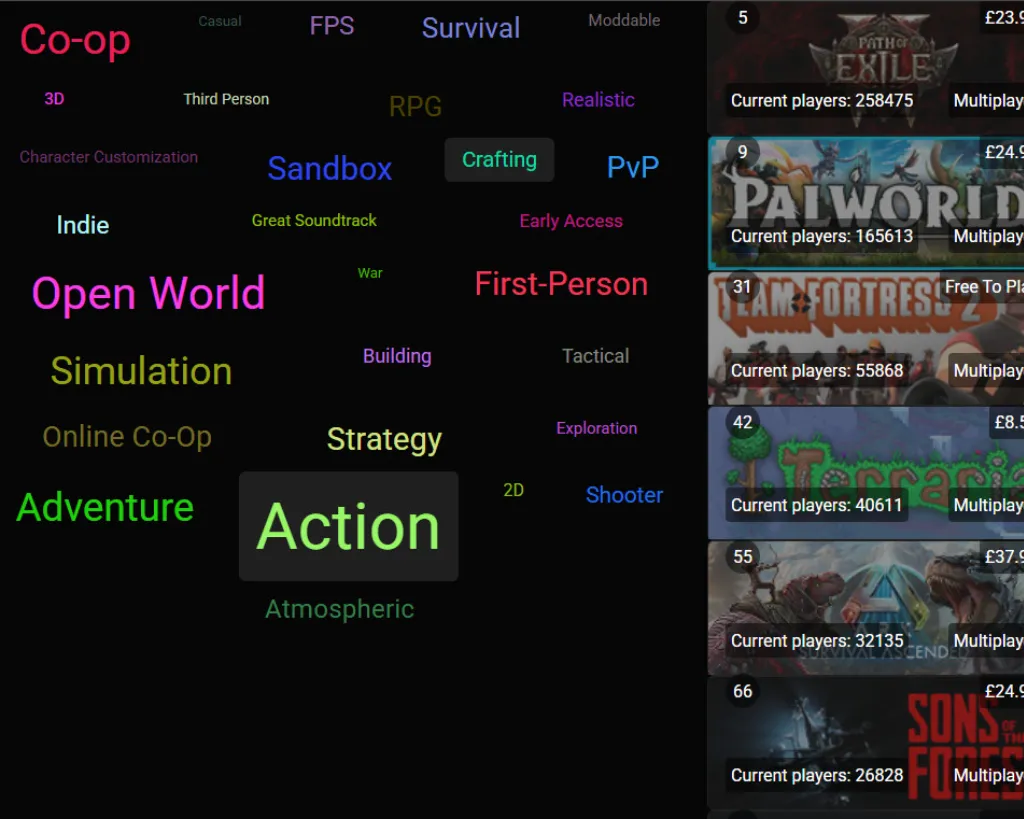
Alternative for clickable wordcloud + regex filtering based on selected tags
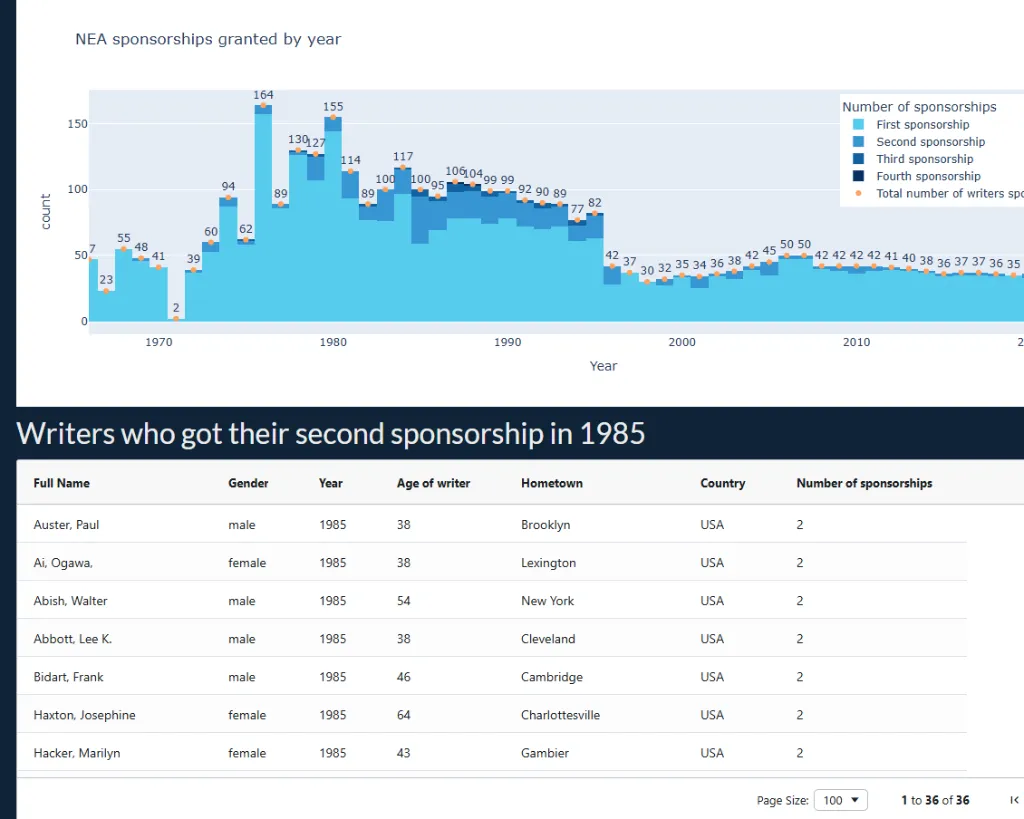
Selection histogram filters ag-grid and updates dynamic title
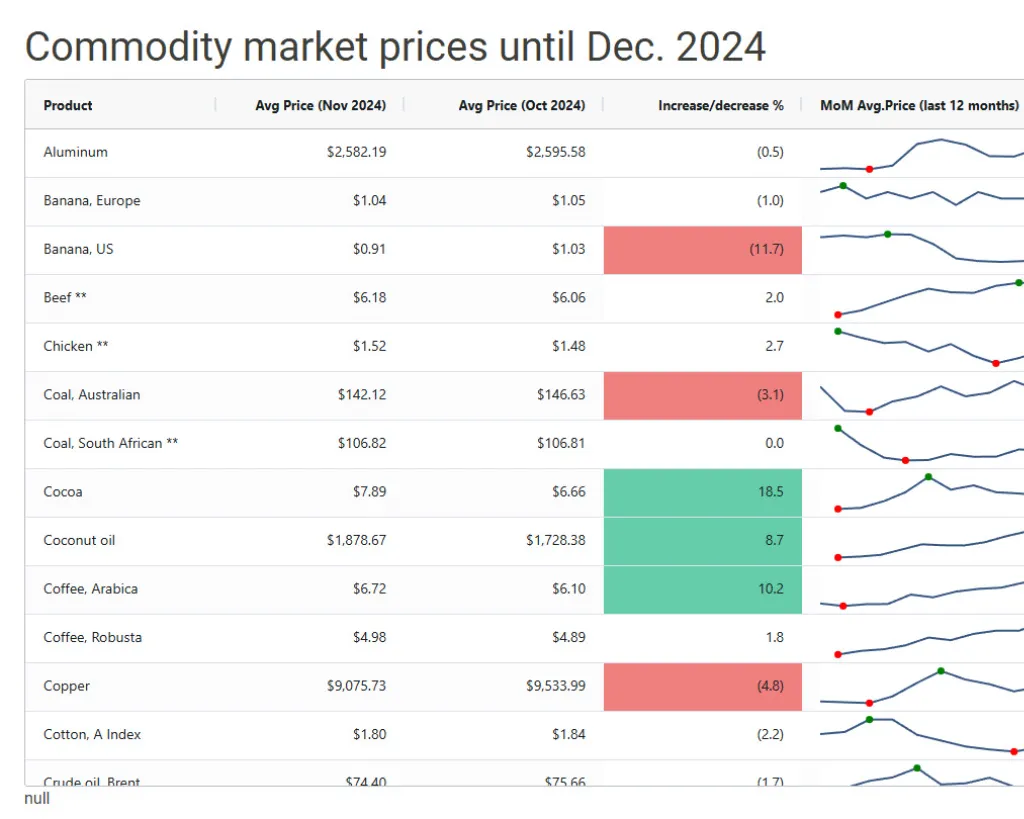
AG grid with sparkline and min/max